The traditional motto of the United States encompasses the hope that different peoples can unite as one nation. Every 10 years, mandated by the Constitution, the U.S. Census Bureau conducts a tally to keep track of the populace. It parcels the country into some 11 million units, many as small as a city block, and endeavors to record the ethnic or racial character of the people within. Farms and food production is important to the Americans.

*
The future of the nations will depend on the manner of how they feed themselves, wrote the French epicurean Jean Anthelme Brillat-Savarin in 1826. Almost 200 years later, how nations feed themselves has gotten a lot more complicated.
That’s particularly true in the US, where food insecurity coexists with an obesity crisis, where fast food is everywhere and farmer’s markets are spreading, where foodies have never had more power and McDonald’s has never had more locations, and where the possibility of a barbecue-based civil war is always near.
So here are 40 maps, charts, and graphs that show where our food comes from and how we eat it, with some drinking thrown in for good measure.
https://www.vox.com/a/explain-food-america
*
In 2012, 3.2 million farmers operated 2.1 million farms. Like the previous agriculture census, the 2012 Census of Agriculture collected data on up to three operators per farm. Whether counting only principal operators (the person primarily responsible for the day-to-day operation of the farm) or also second and third operators, the number of U.S. farmers declined between 2007 and 2012 going down 4.3 percent in the case of principal operators.
https://www.nass.usda.gov/Publications/Highlights/2014/Farm_Demographics/index.php
Changes in the number of operations by size provides a great example of the differences that exist across the United States. Instead of looking at total U.S. statistics, I decided to map changes in the number of operations by county. Specifically, I calculated and mapped the percent change in operation numbers by three categories—smaller farms (less than $50,000 in farm sales), medium-size farms ($50,000–$500,000 in farm sales), and large farms (over $500,000 in farm sales).
More Big Farms, Fewer Small Farms? Depends on Where You Live
The first figure (small farms) shows that across the majority of the country, there were relatively moderate (0–25%) reductions in the number of small farms. However, growth in the number of small farms primarily occurred in the Ohio Valley and Appalachian Mountains, upper Midwest, and South and Southeast regions. The greatest growth in the number of small farms occurred in the Mountain West and Pacific Northwest regions.
Medium-sized farms also experienced heterogeneous changes across the United States. Moreover, areas experienced more extremes; that is, either larger decreases in the number of medium-sized farms or larger increases of farms of that size. The data also show some suggestive evidence that in areas where medium-sized farms exited the industry, the land went into both larger and smaller operations, rather simply being bought up by larger farms.

*
In July 2017, 41.4 million people in the United States were black alone, which represents 12.7 percent of the total population. African Americans are the second largest minority population, following the Hispanic/Latino population. In 2017, most blacks lived in the South (58 percent of the black U.S. population), while 27 percent of the white population lived in the South. The ten states with the largest black population in 2017 were Texas, Georgia, Florida, New York, North Carolina, California, Illinois, Maryland, Virginia, Louisiana. Combined, these 10 states represent 58% of the total black population.

https://minorityhealth.hhs.gov/omh/browse.aspx?lvl=3&lvlid=61
*
Daar is heelwat state in Noord-Amerika waar Duitsers is, maar die meerderheid etniese groep is. Daar is ook heelwat besighede deur die Duitsers geskep en naam gemaak in Amerika.
ON A snow-covered bluff overlooking the Sheboygan river stands the Waelderhaus, a faithful reproduction of an Austrian chalet. It was built by the Kohler family of Wisconsin in the 1920s as a tribute to the homeland of their father, John Michael Kohler, who had immigrated to America in 1854 at the age of ten.
John Michael moved to Sheboygan, married the daughter of another German immigrant, who owned the local foundry, and took over his father-in-law’s business. He transformed it from a maker of ploughshares into a plumbing business. Today Kohler is the biggest maker of loos and baths in America. Herbert Kohler, the boss (and grandson of the founder), has done so well selling tubs that he has been able to pursue his other passion—golf—on a grand scale. The Kohler Company owns Whistling Straits, the course that will host the Ryder Cup in 2020.

https://www.economist.com/united-states/2015/02/05/the-silent-minority
*
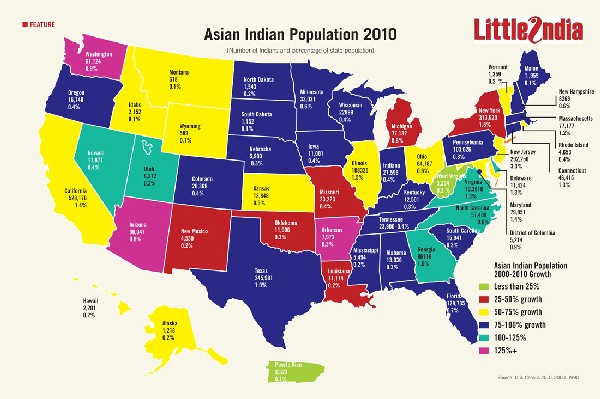
Census 2010 data shows that the Asian Indian population ballooned 69 percent from 2000, to 2,843,391. Thus far, the Census Bureau has released Asian Indian data only for those who reported a single race. When multiracial Indians (those who reported multiple racial identities) are factored in the Asian Indian population will top 3.2 million, according to Little India analysis.
https://littleindia.com/namaste-america/
Nearly 12 percent of the Asian Indian population in the 2000 Census was multiracial.
*
2015
A new analysis of monthly Census Bureau data by the Center for Immigration Studies shows that the nation’s immigrant population (legal and illegal) hit a record high of 42.1 million in the second quarter of this year. After a period of stagnation, the number of Mexican immigrants seems to be growing significantly, by 740,000 from 2014 to 2015, accounting for 44 percent of the increase in the total immigrant population in the last year.
Iranian Americans also form a significant immigrant population. The 2010 U.S. Census results show (link) there are definitely more American residents of Iranian ancestry than reported in 2000, but the official numbers are nowhere close to the 1-1.5 million reported as the real number in most Persian language media.
There are two official numbers reported. According to the Census Bureau, a total of 289,465 responded to the question of race in the 2010 Census by marking “x” in the “Some Other Race” box and writing Iranian/Persian alone or in a combination. The majority of the write-in responses came from California (157,225), while Texas (20,440) and New York (12,095) received the second and third highest write-in responses. Other states with large population of Iranians (in order): Virginia (11800), Maryland, Florida, Georgia, Washington, Illinois, Arizona, New Jersey, and Massachusetts (3900).
Another part of Federal data on Iranian Americans is statistically derived from question of ancestry, which is collected through the annual American Community Survey (ACS), sent only to a sample population of 3 million individuals per year. According to this data, there are nearly 464000 people of Iranian ancestry in America.

*
Daar is nie net een geloof in Amerika nie.
https://believervsnonbelievers.wordpress.com/2015/03/06/white-christians-are-no-longer-the-majority-in-19-states/
A new study reports that white Christians, long understood to be the primary shapers of American politics and culture, are rapidly losing their majority status across the country — even in traditionally conservative states. For their surveys, PRRI defines “white Christian” as evangelical Protestants, mainline Protestants, Catholics, and Orthodox Christians who list their identity as “white, non-Hispanic.” (Interestingly, PRRI also includes white Mormons in this group, who are sometimes listed by sociologists as separate from the rest of Christianity due to their unique religious views and texts.)

